Infographics create a unique challenge, they allow the designer to take a larger idea or concept and place it into one image.
For example, the budget 2021-2022 graphic for Great Lakes Church. This graphic breaks down where they placed their resources throughout the year.
Below is the infographic I created for a case study on how gardening activities can be used to teach various common core learning standards for the Spokane School District. I took inspiration from the London Underground maps that use a geometric approach, using only 90º angles and color codes to represent the learning standards. This shows how multiple learning standards are taught through the hands-on activity examples.
Working for Cheeky Scientist really helped develop my love for creating infographics. My initial idea of an infographic was incredibly narrow prior to this experience. I pictured an infographic being much like the Spokane School District one above, with lines indicating how two concepts relate. But an infographic can be so much more than just creating a map, it can indicate broad ideas or separate out minute details of an idea. I drew inspiration from many sources during my as Cheeky Scientist’s first Graphic Design Manager.
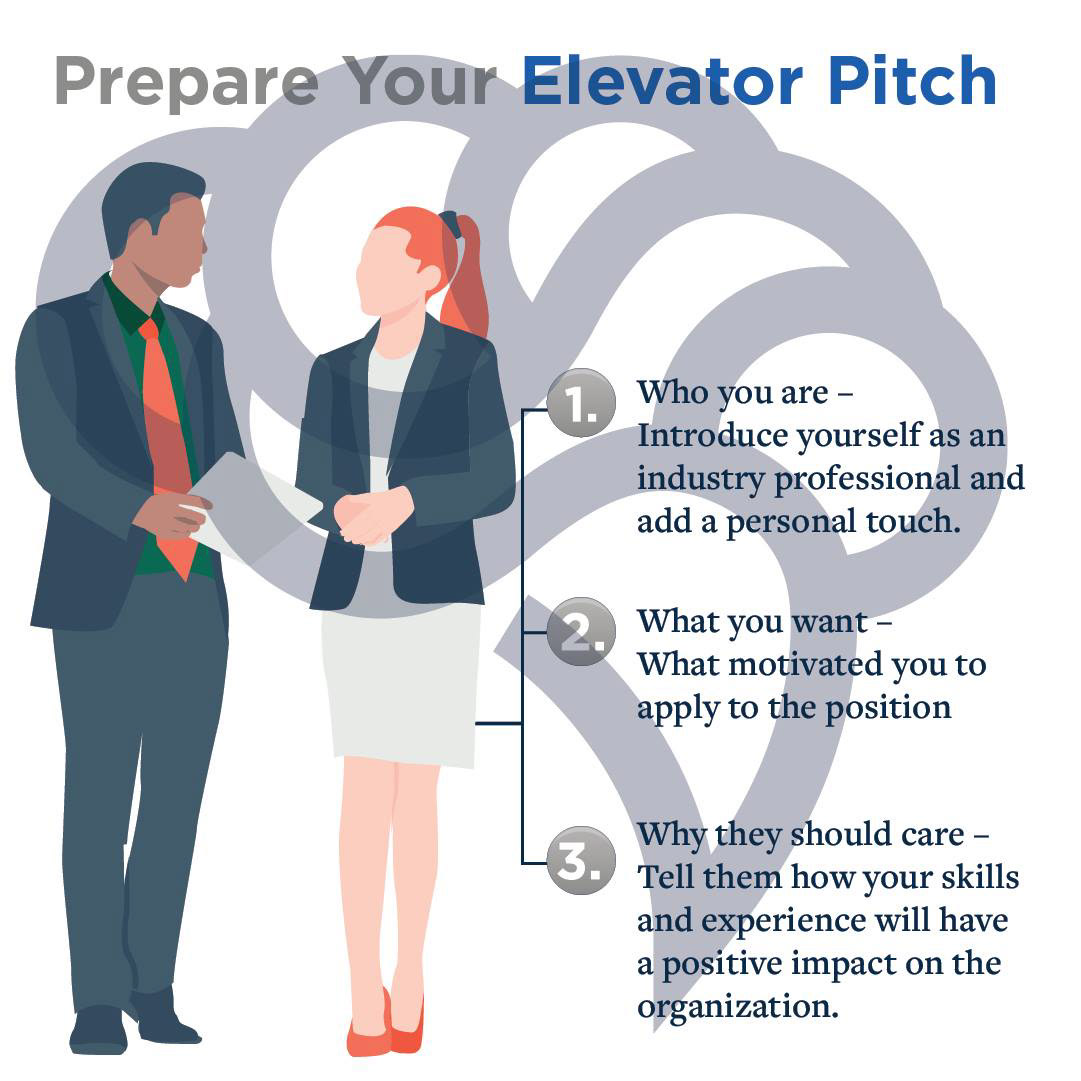
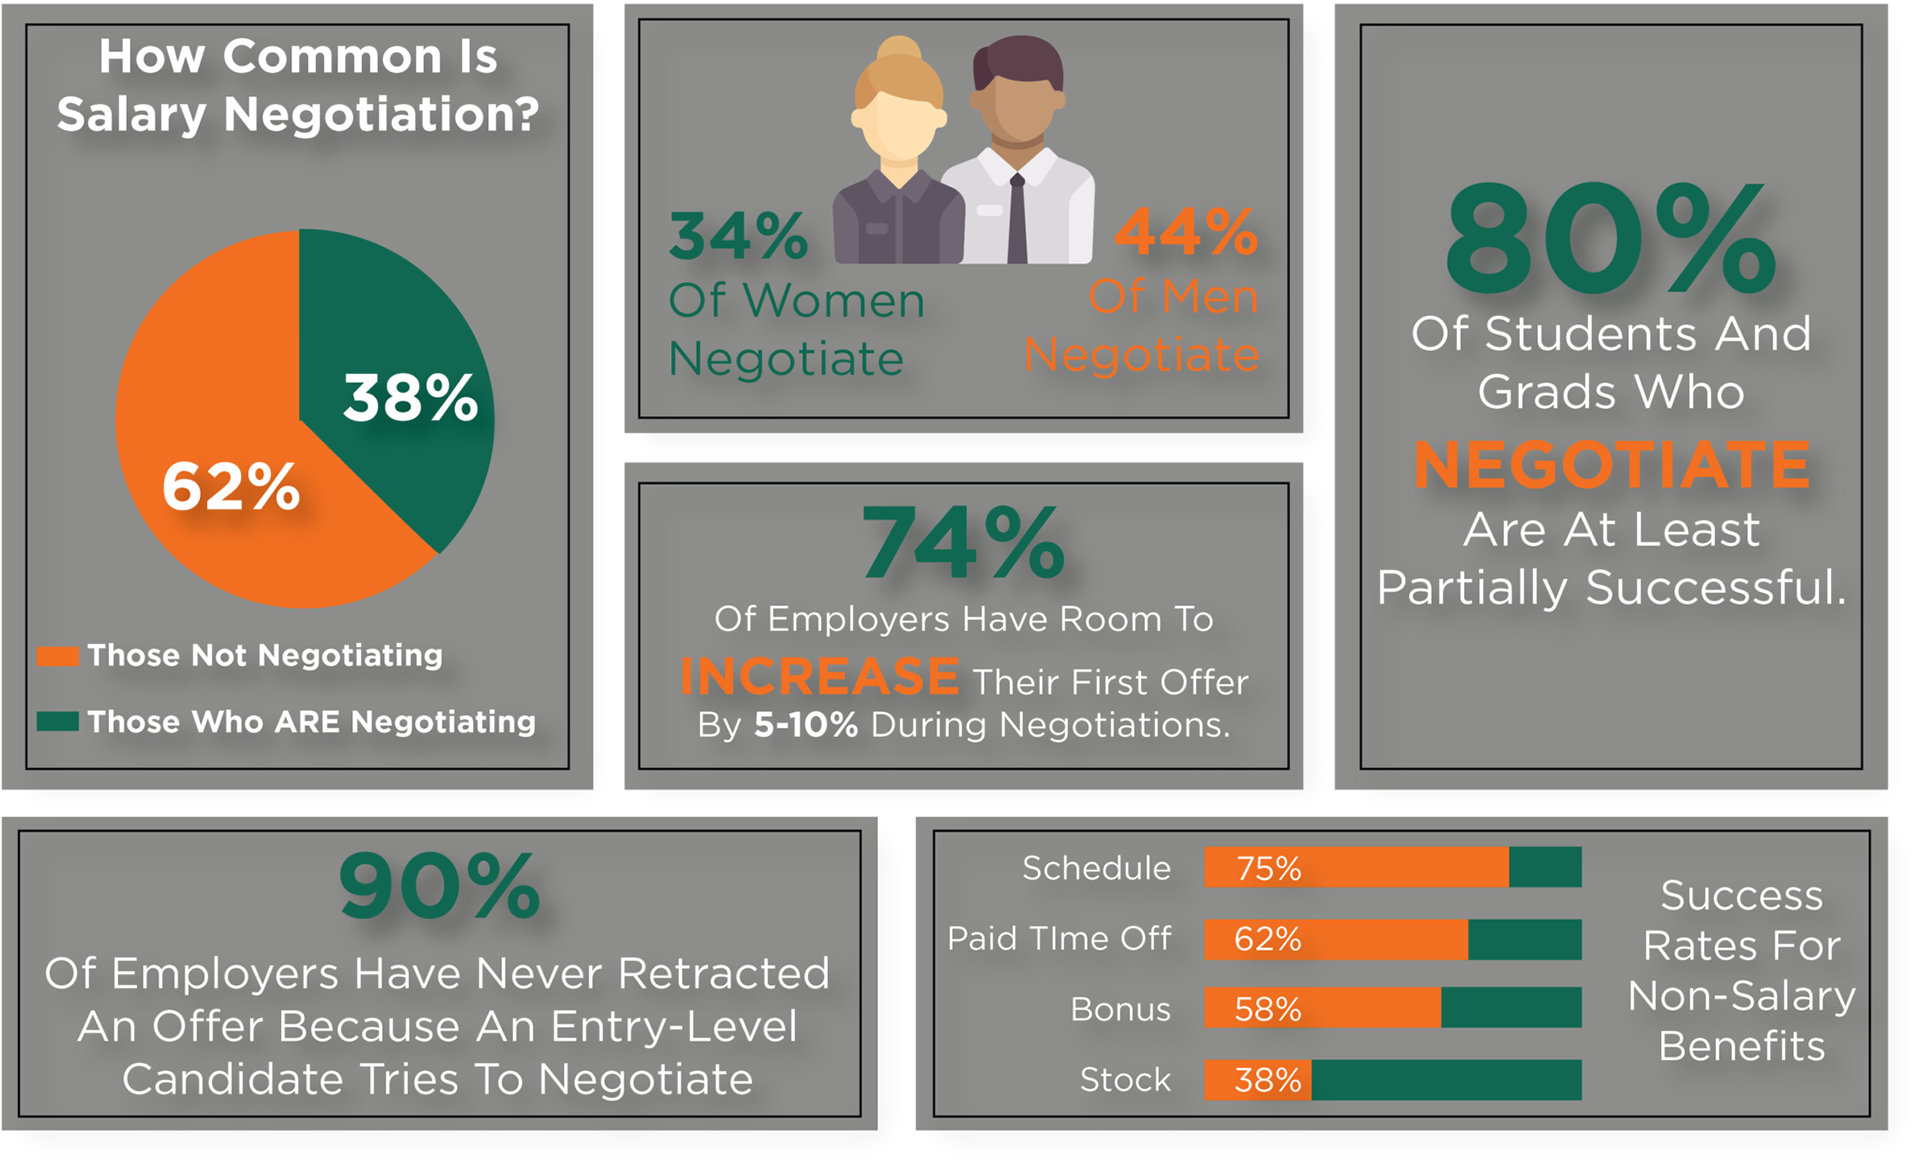
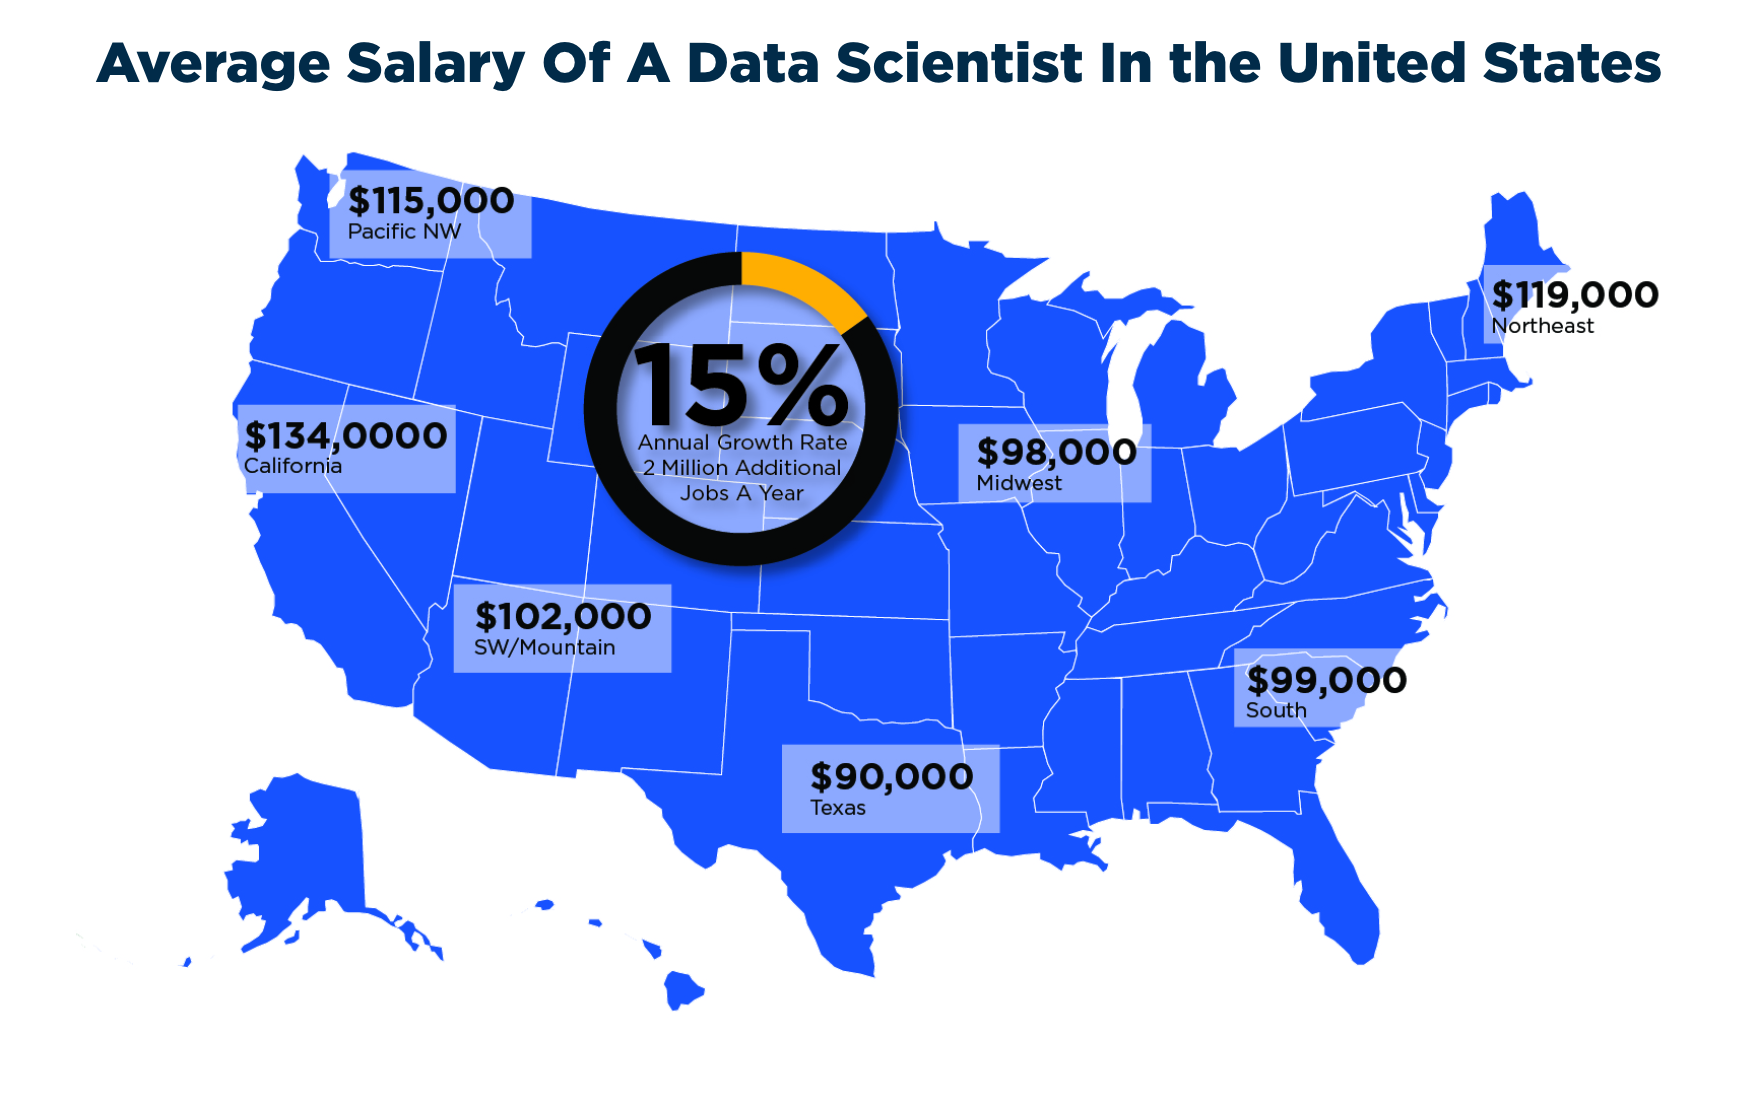
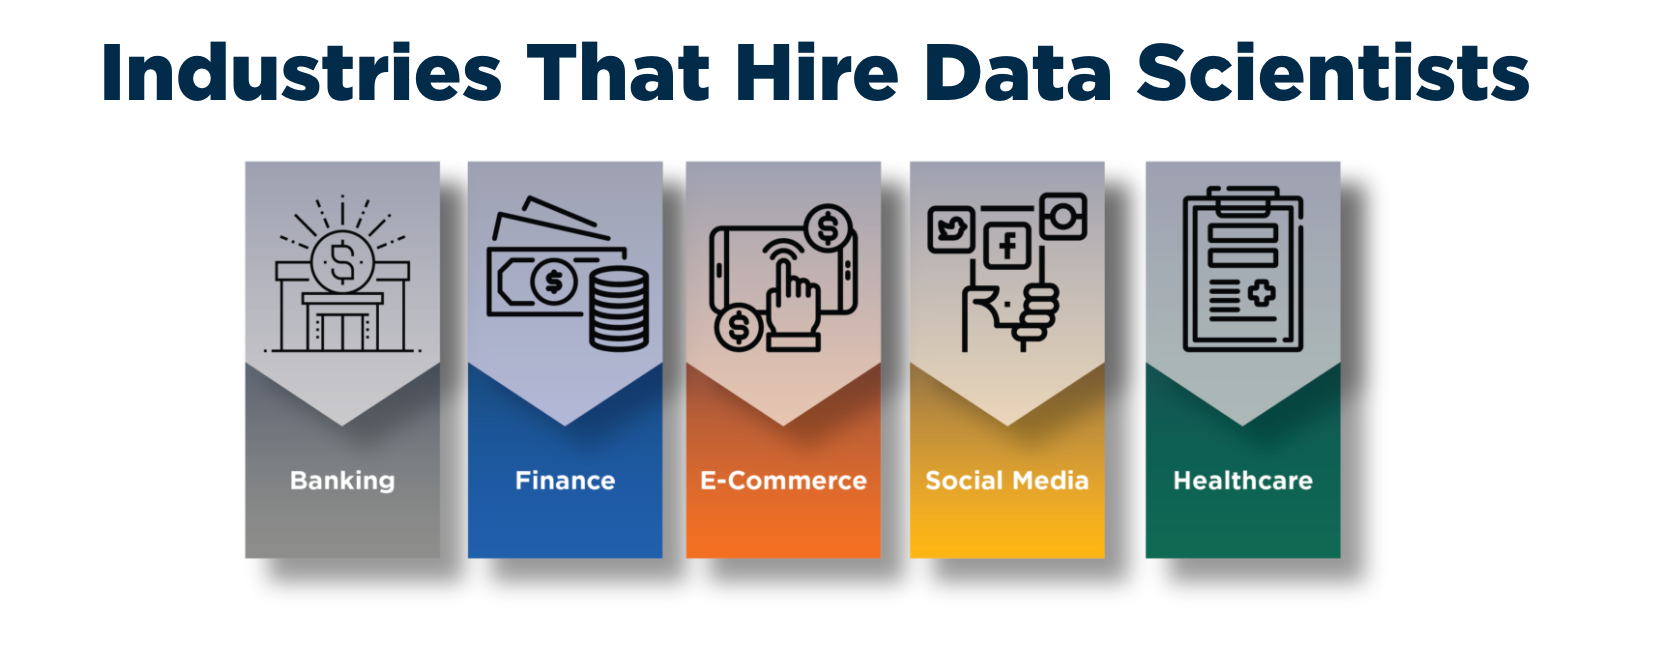
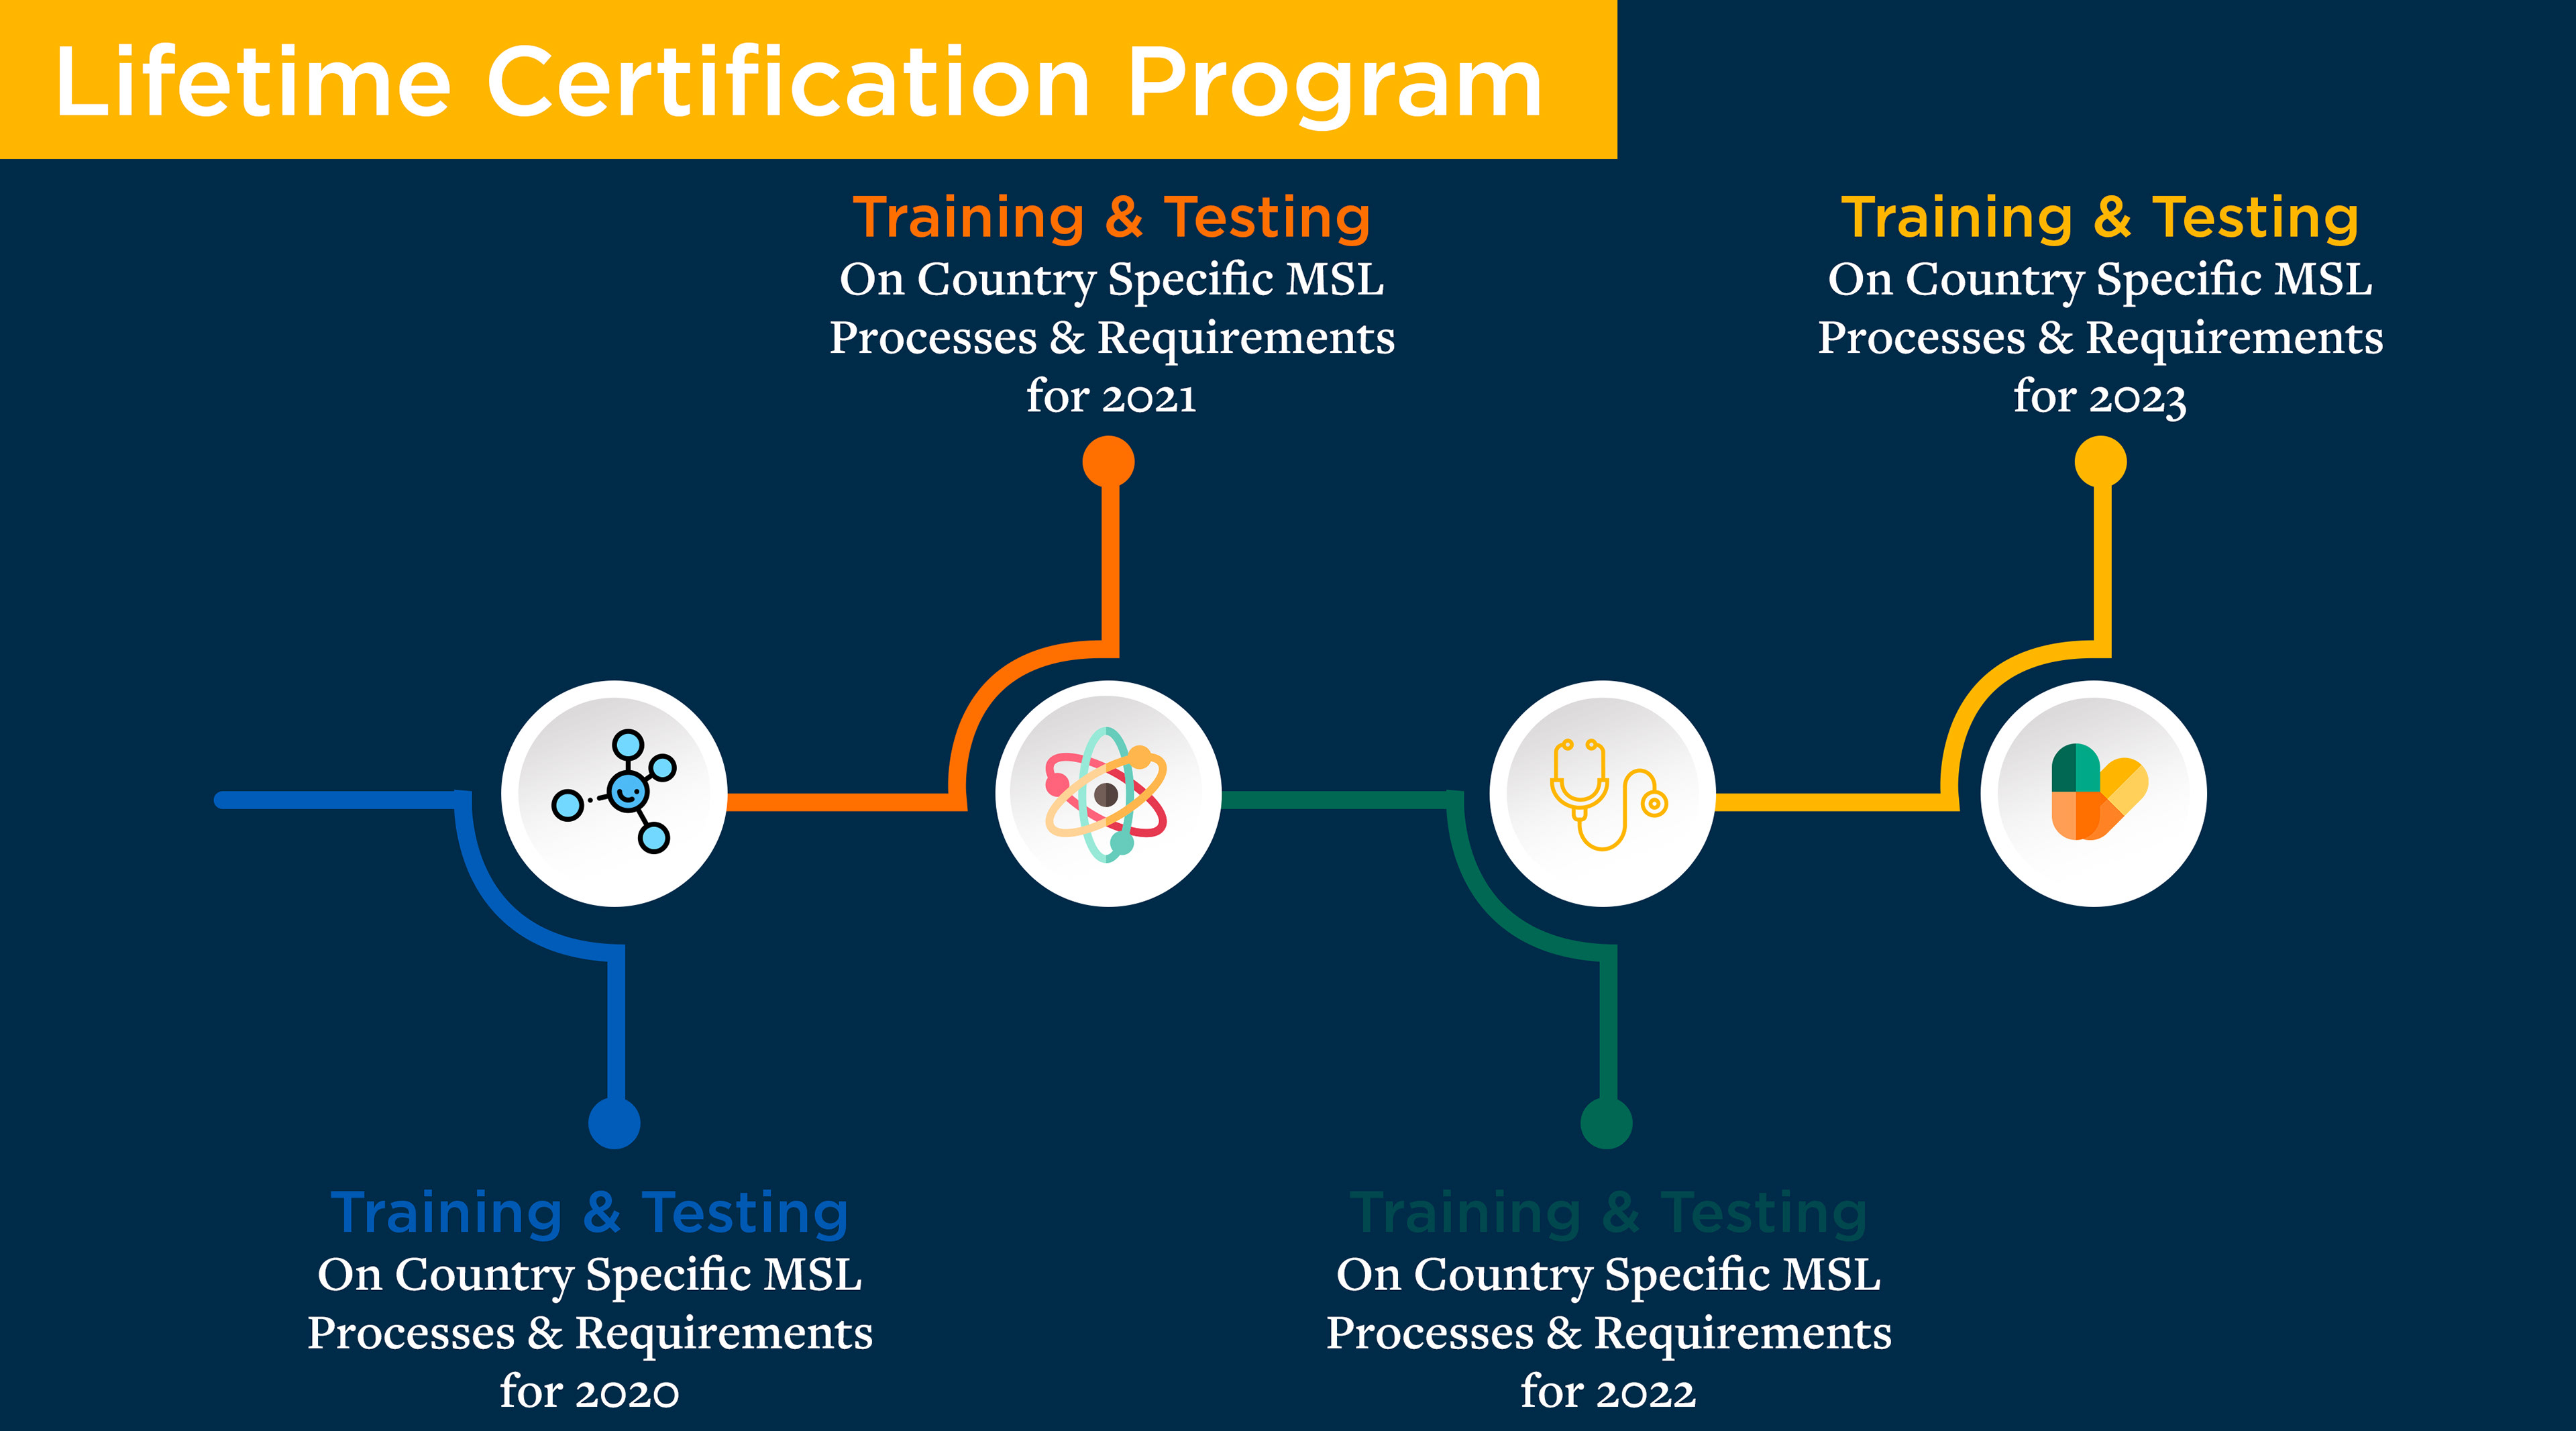
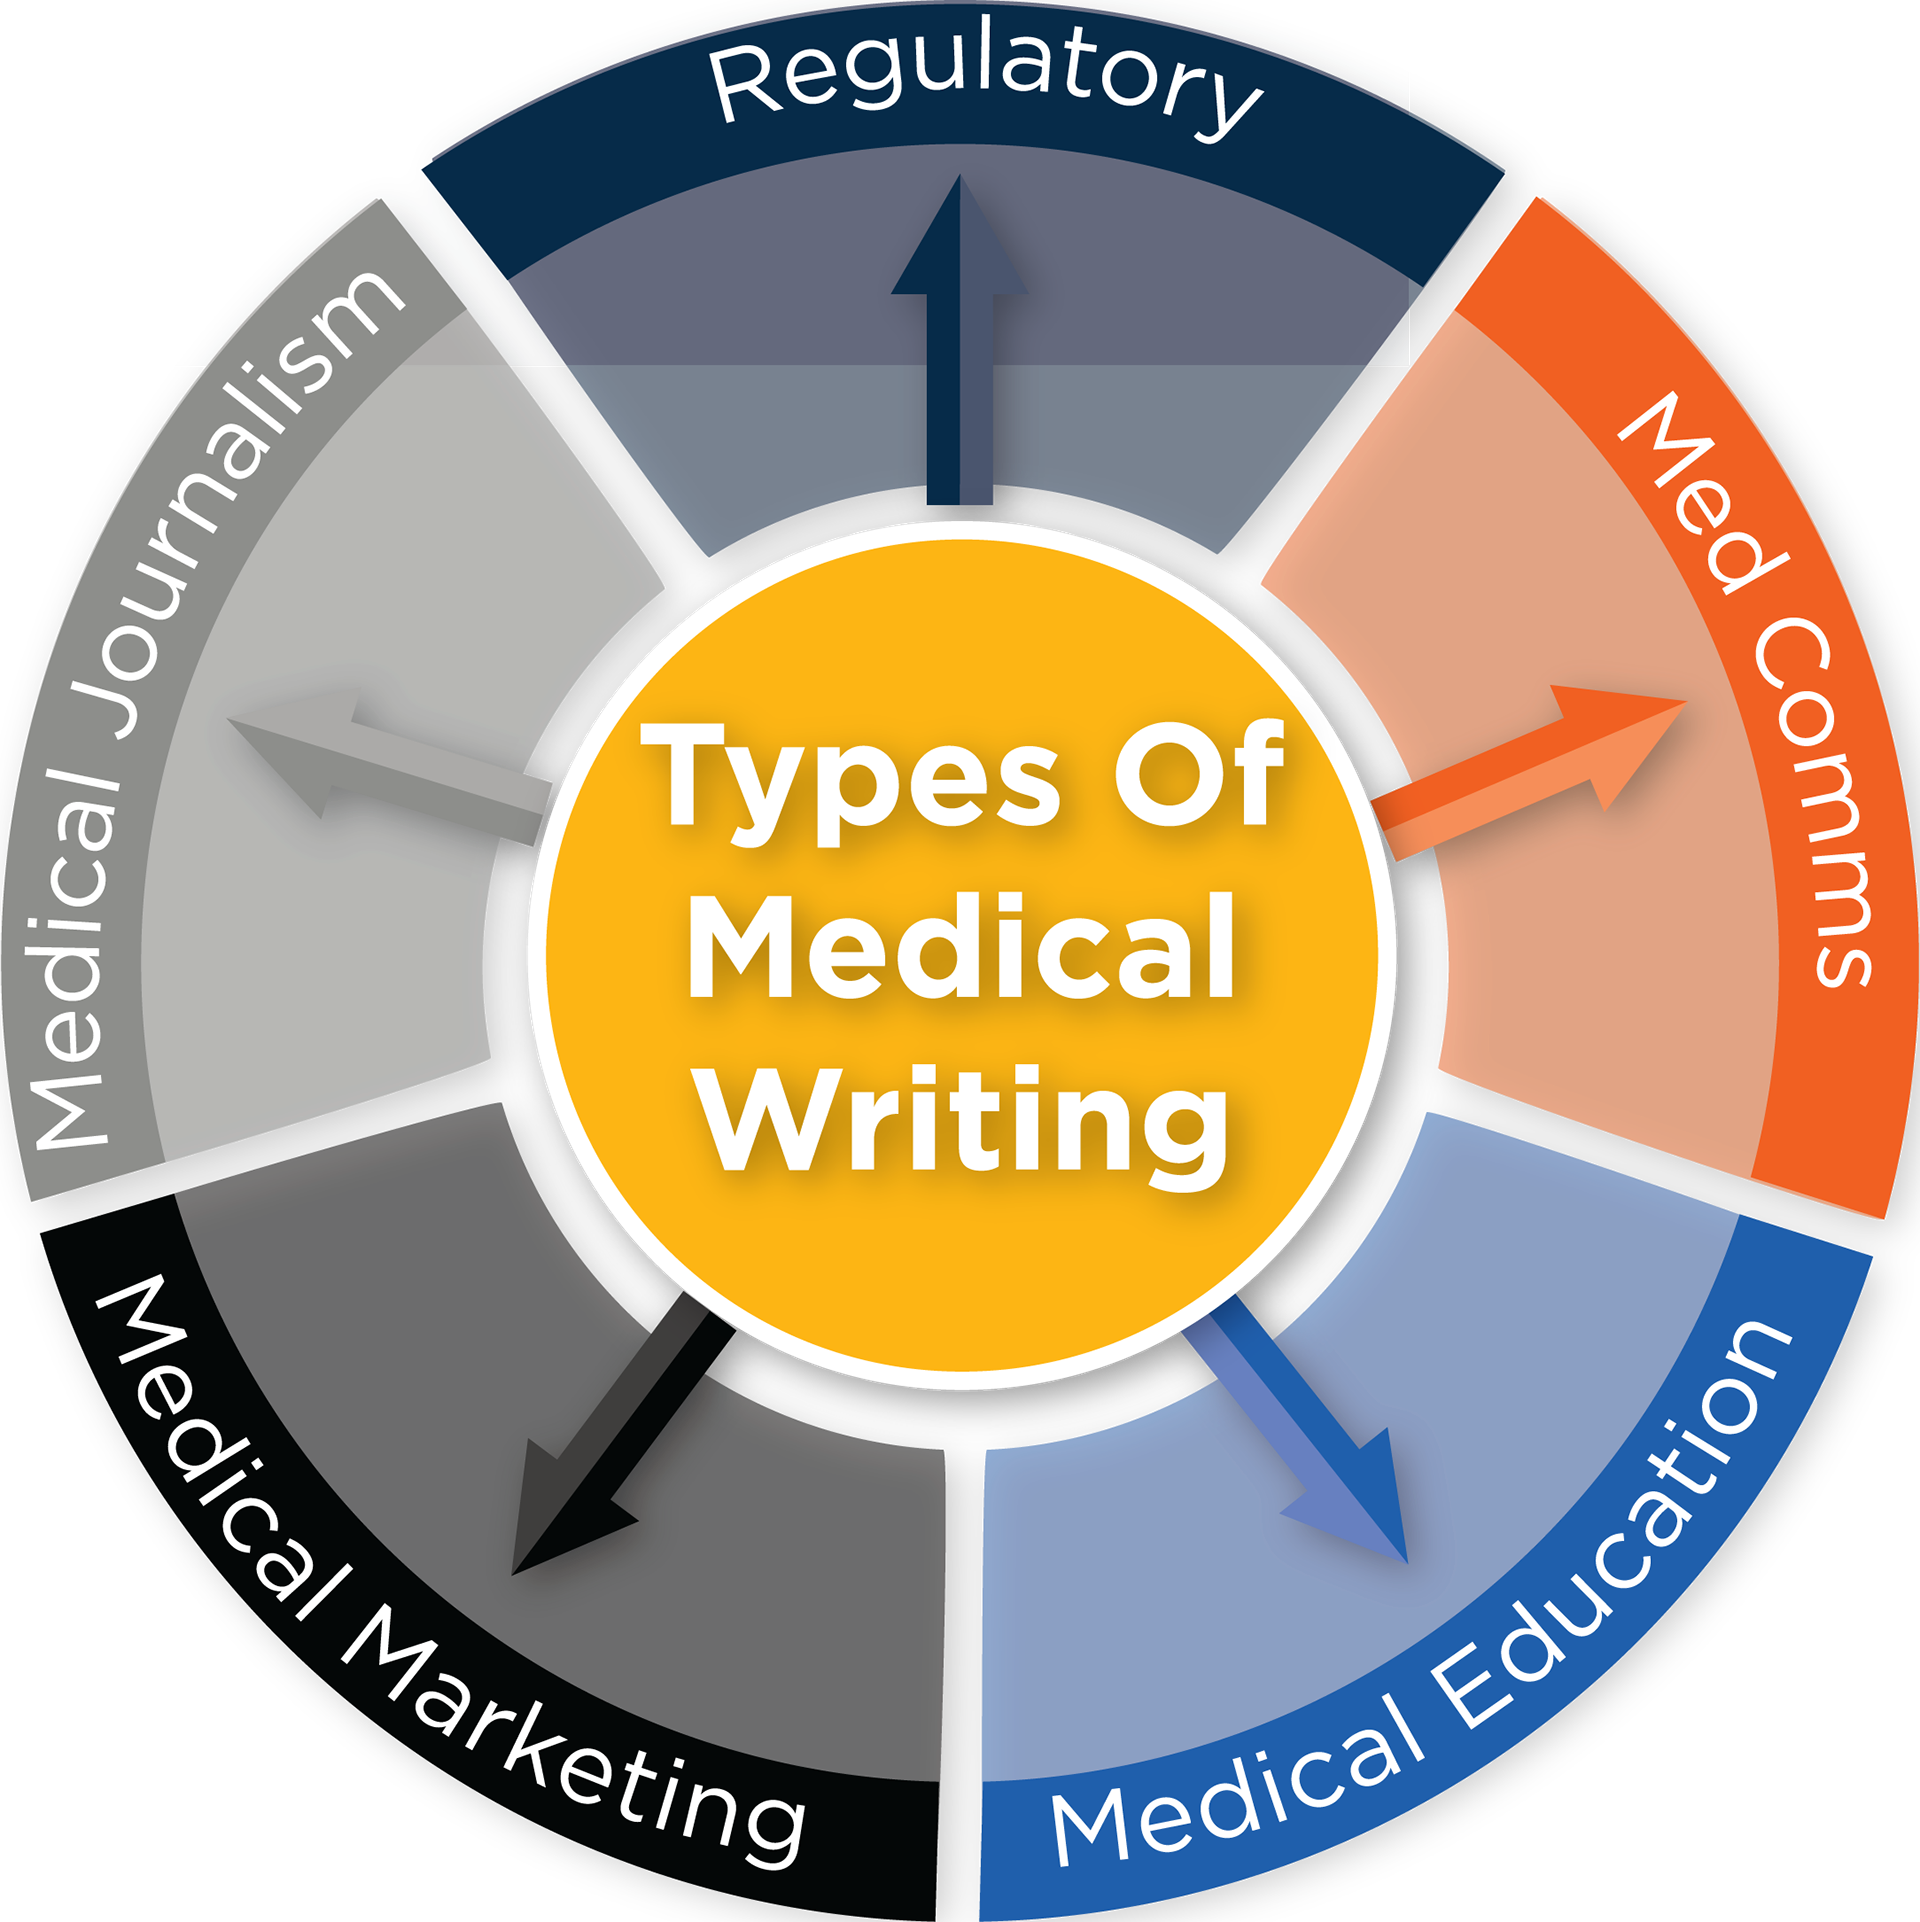
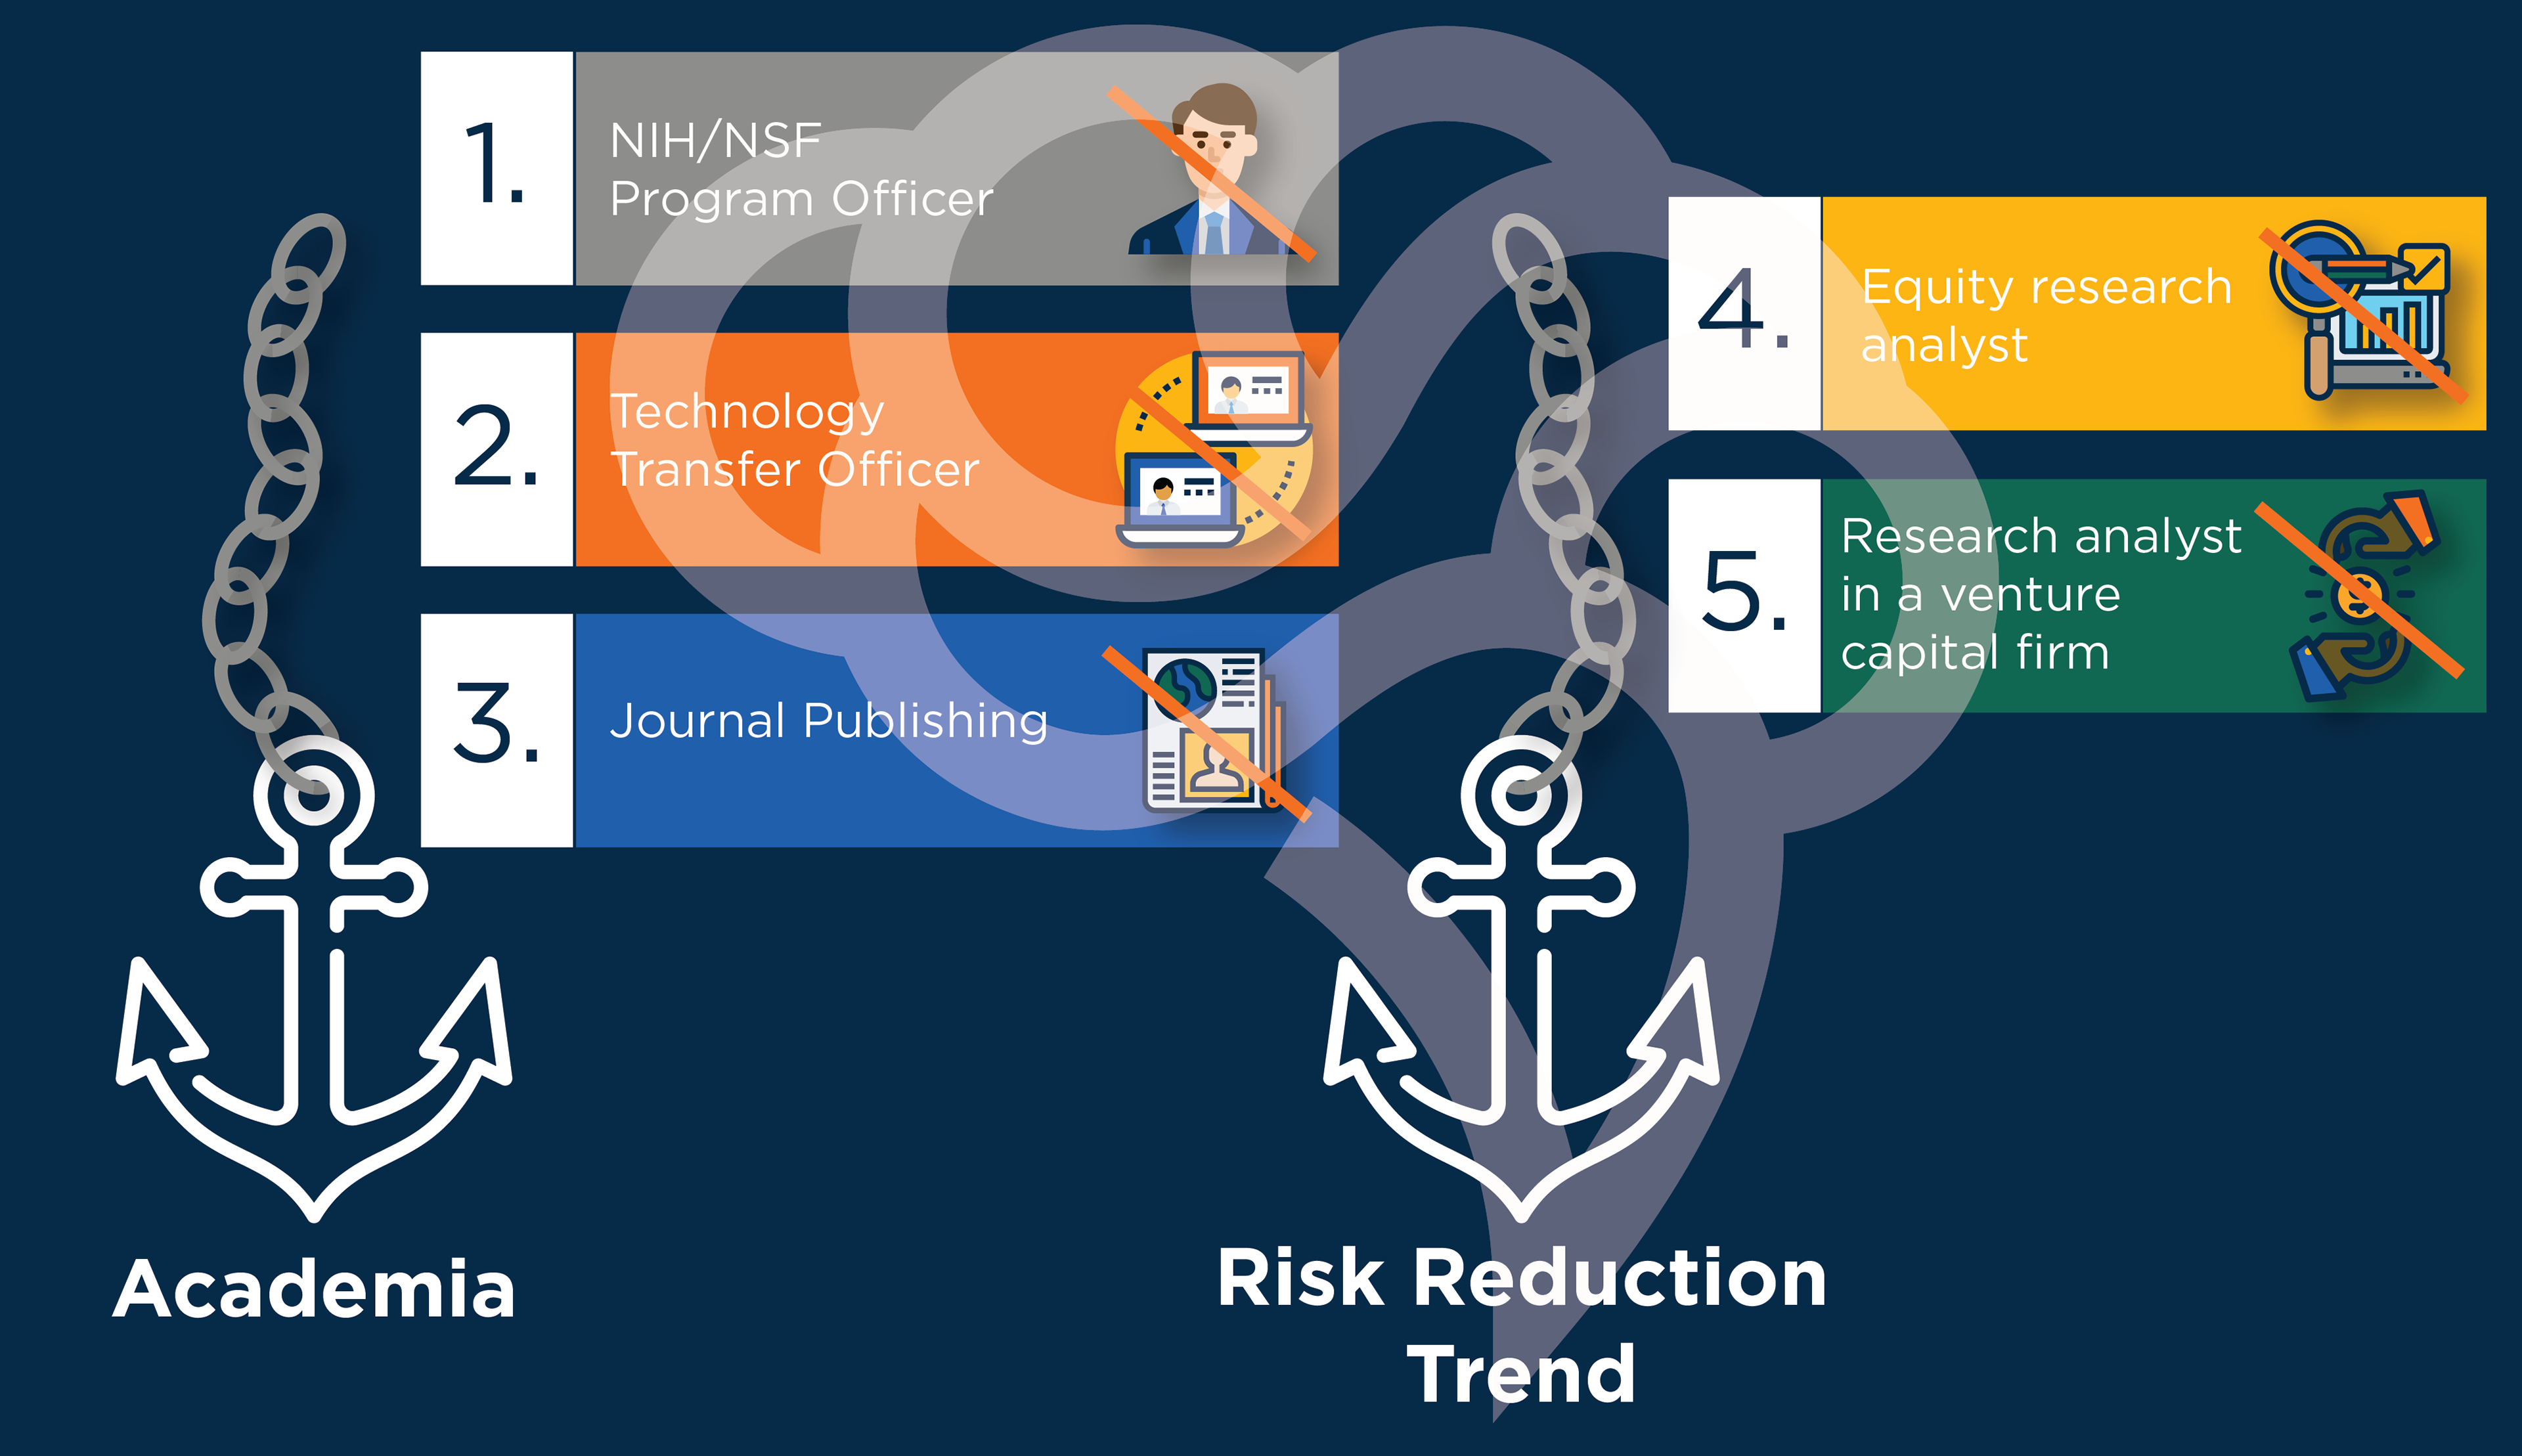
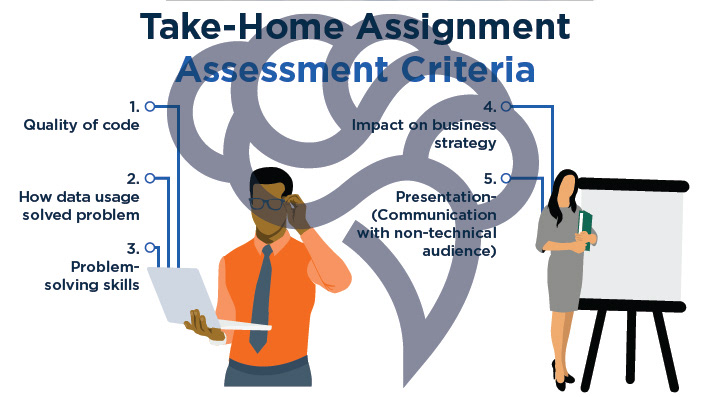
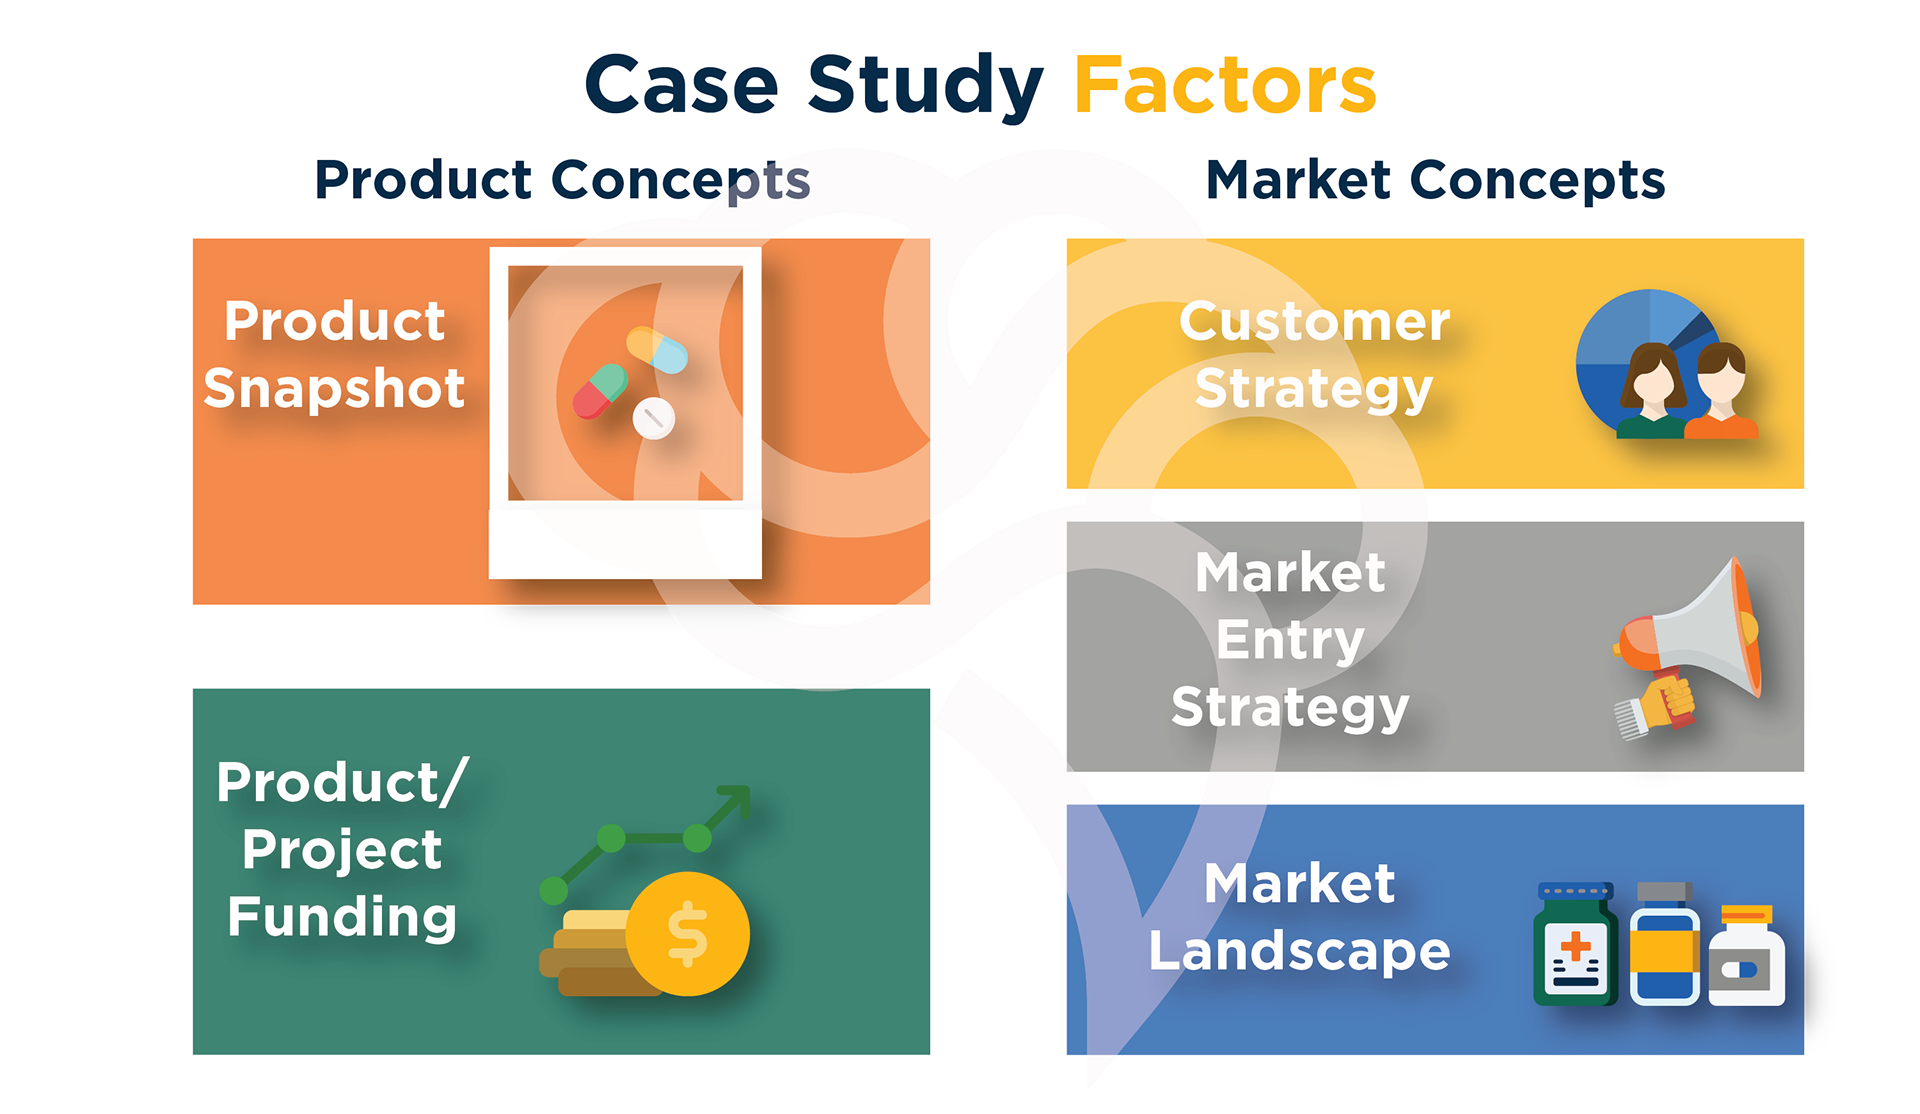

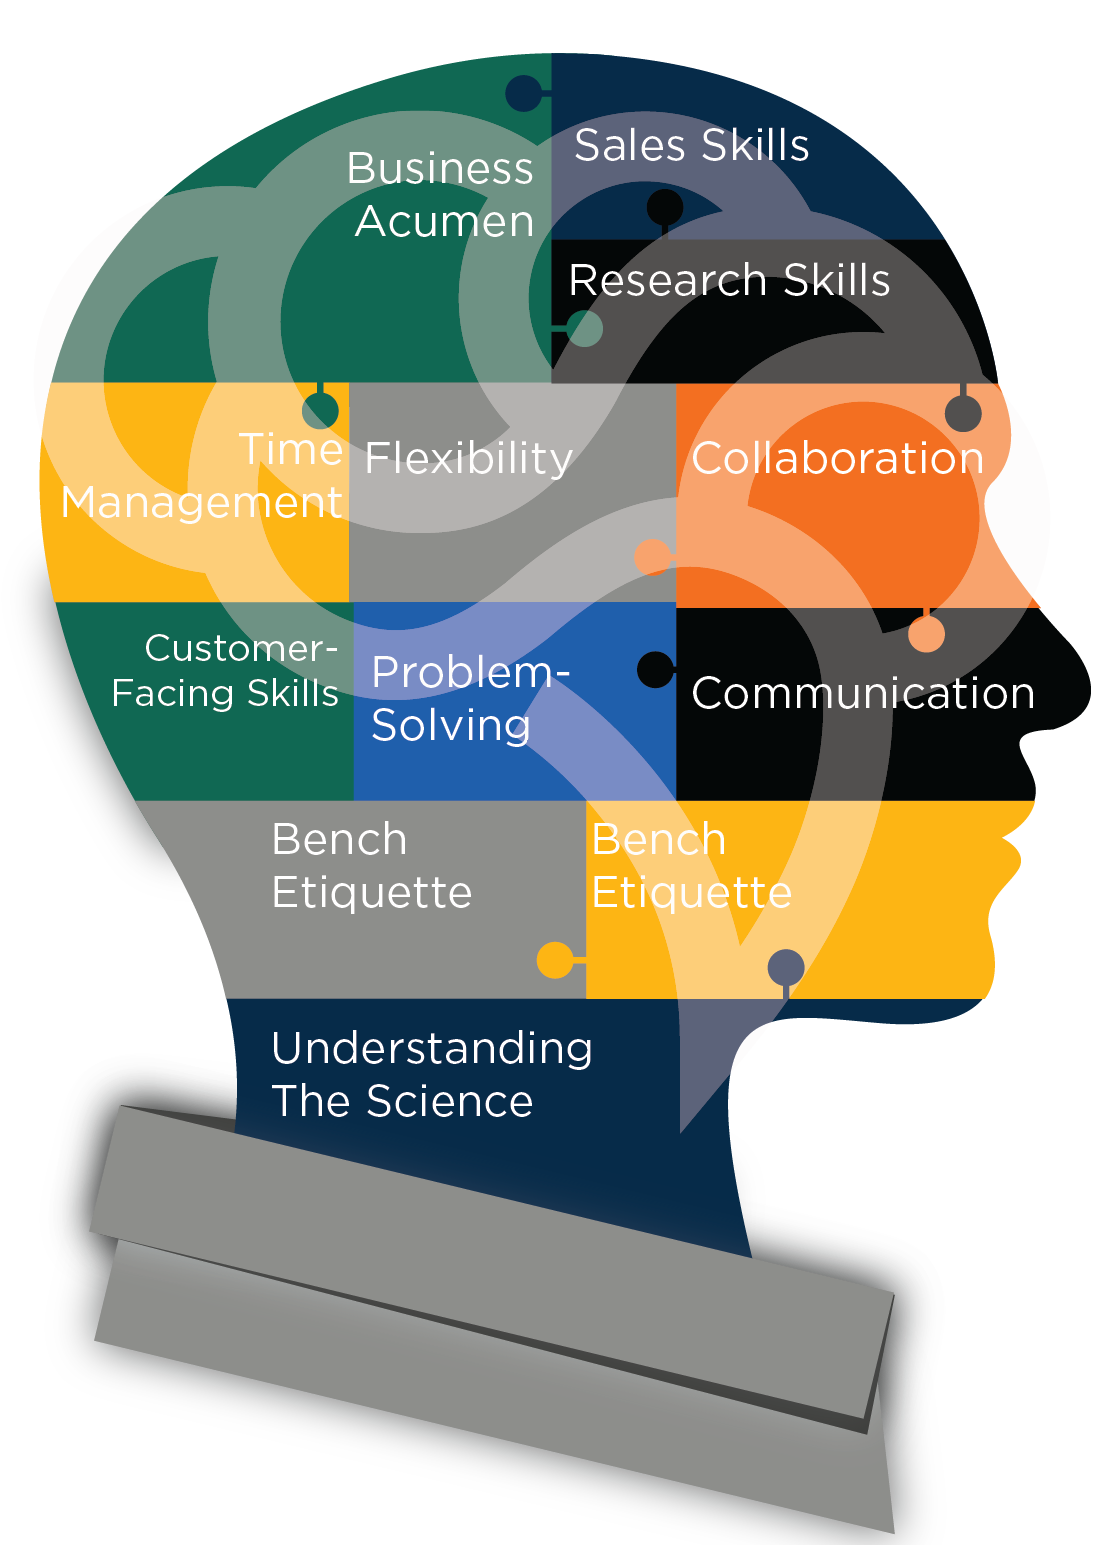
“The Association’s Methodology” is my favorite infographic I have made to date. I worked closely with Amanda Johnson, PhD, who gave me the necessary information and outline for this one, allowing me to bring it to life! We were tasked with displaying the journey most PhDs go through when looking for an industry position, including obstacles and how Cheeky Scientist assists along the way.
Dashboard Walkthroughs are a cross between a pamphlet and a multipage infographic. During one of our daily checkins, I heard our lead sales manager talking about his process for explaining what Cheeky Scientist has to offer. And so the idea of a dashboard walkthrough was born. This would be a great tool for new sales associates to make sure that they are showcasing what the various programs have to offer, as well as a good visual for the incoming PhDs to see the value of the programs.
*Cheeky Scientist owns all designs shown. I am only the designer behind these graphics. All designs can be found on publicly accessible locations.